Source code
% Exécution/publish de ce code sous Octave
% Données
x= 4*rand(1,50) -2 % val. aléatoires entre -2 et +2
y= 4*rand(1,50) -2 % val. aléatoires entre -2 et +2
z= x.*exp(-x.^2 - y.^2) % Z en ces points
% Premier graphique (double, de type multiple plots)
figure(1)
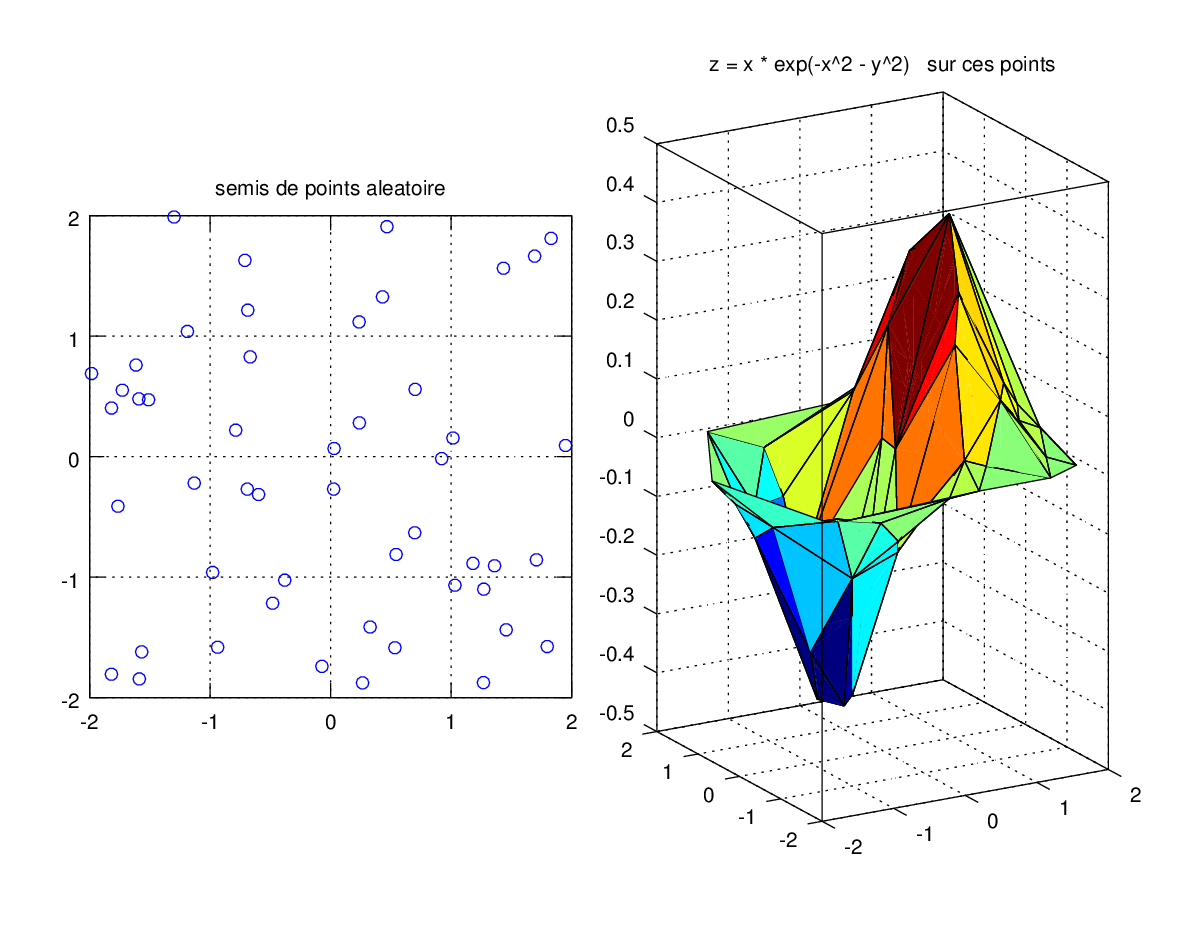
subplot(1,2,1)
plot(x,y,'o')
title('semis de points aleatoire')
grid('on')
axis([-2 2 -2 2])
axis('equal')
subplot(1,2,2)
tri_indices= delaunay(x, y); % form. triangles => matrice indices
trisurf(tri_indices, x, y, z) % affichage triangles
title('z = x * exp(-x^2 - y^2) sur ces points')
zlim([-0.5 0.5])
set(gca,'ztick',-0.5:0.1:0.5)
view(-30,10)
% Second graphique (simple)
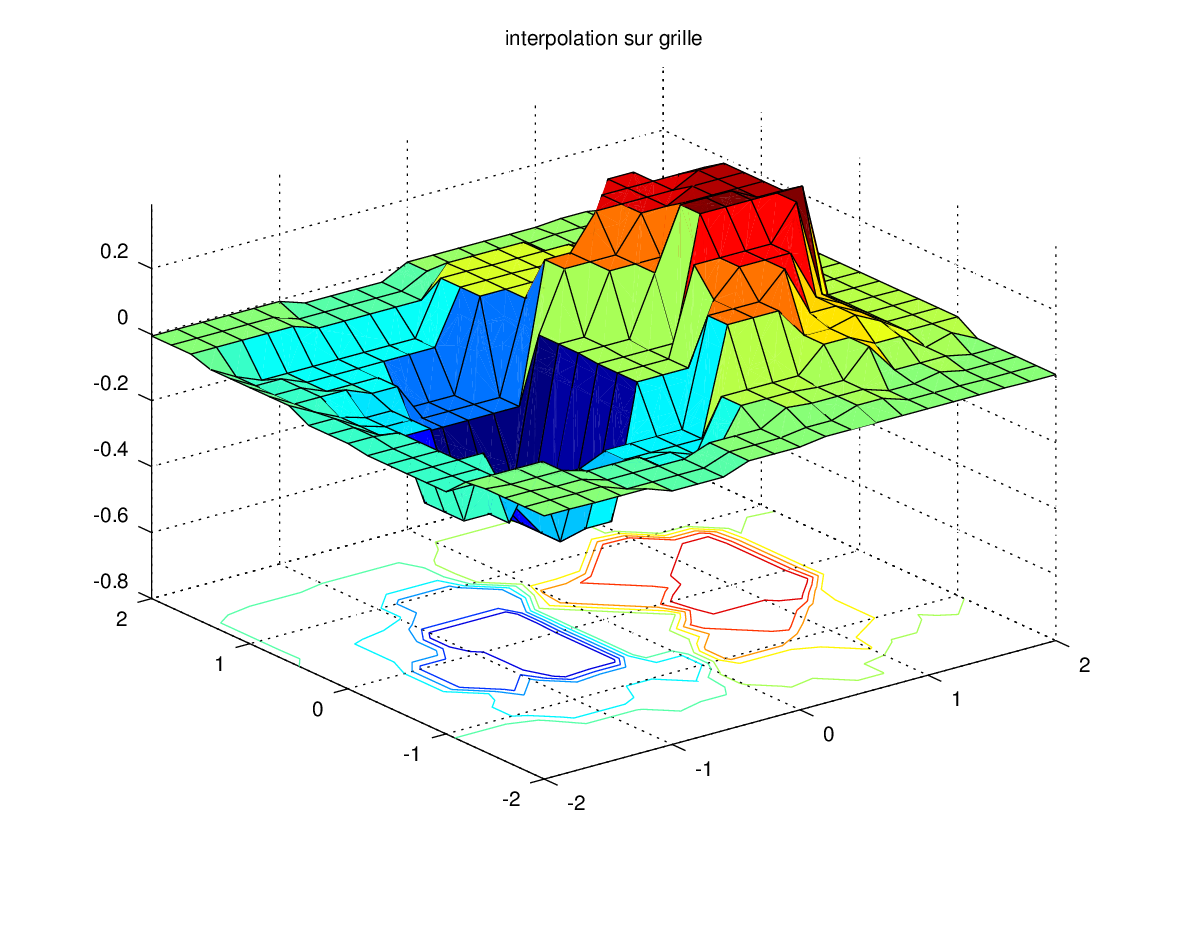
figure(2)
xi = -2:0.2:2 ;
yi = xi';
[XI,YI,ZI] = griddata(x,y,z,xi,yi,'nearest'); % interp. grille
surfc(XI,YI,ZI)
title('interpolation sur grille')
Execution results
octave>code
x =
Columns 1 through 12:
-0.711277 1.031517 0.327671 0.701202 -1.131552 0.236466 -0.072093 -1.590966 1.180869 -1.614633 1.692675 -1.728358
Columns 13 through 24:
-0.978867 1.797570 0.533581 -0.380762 0.264924 1.015095 -1.983907 0.921488 1.433961 -0.687380 0.697966 1.360161
Columns 25 through 36:
0.467363 1.829331 1.268178 -1.567613 -1.188233 -0.937531 0.028664 0.430415 -1.818034 -0.787484 1.707725 0.024852
Columns 37 through 48:
1.456737 -1.510584 -1.299083 -0.667355 -0.691486 0.543431 1.948800 -1.818902 -1.764569 0.238536 -0.598038 -1.587296
Columns 49 and 50:
-0.481327 1.270587
y =
Columns 1 through 12:
1.628832 -1.066901 -1.413631 0.558078 -0.219686 1.117772 -1.739915 0.479013 -0.885814 0.760002 1.663388 0.551133
Columns 13 through 24:
-0.960733 -1.575612 -1.585553 -1.024944 -1.877391 0.154525 0.689358 -0.016323 1.563110 1.215017 -0.631476 -0.905292
Columns 25 through 36:
1.908100 1.810704 -1.875105 -1.619710 1.038848 -1.581501 0.067780 1.325663 0.403290 0.219582 -0.855898 -0.269151
Columns 37 through 48:
-1.436739 0.471973 1.988235 0.827636 -0.269838 -0.811699 0.092623 -1.805605 -0.411711 0.280371 -0.313840 -1.844641
Columns 49 and 50:
-1.216378 -1.099713
z =
Columns 1 through 11:
-0.0302064 0.1140323 0.0398966 0.3140842 -0.2996675 0.0641019 -0.0034745 -0.1006319 0.1336050 -0.0668346 0.0060621
Columns 12 through 22:
-0.0643256 -0.1491879 0.0059321 0.0324897 -0.1152016 0.0072766 0.3536976 -0.0240882 0.3940915 0.0159369 -0.0979179
Columns 23 through 33:
0.2877961 0.0942326 0.0098535 0.0024269 0.0075462 -0.0097419 -0.0984078 -0.0319171 0.0285089 0.0616894 -0.0566913
Columns 34 through 44:
-0.4036288 0.0444353 0.0231009 0.0221459 -0.1234244 -0.0046123 -0.2155036 -0.3985678 0.2092921 0.0433181 -0.0025533
Columns 45 through 50:
-0.0661849 0.2083068 -0.3789899 -0.0042528 -0.0869467 0.0754504
Generated graphics